Version [72039]
Dies ist eine alte Version von PmTimeCostQuality erstellt von NicoleHennemann am 2016-09-27 12:30:14.

Time, Cost & Quality Management
Inhalte von Prof. Dr. Kurt Englmeier
Project Time Management
Projects are temporary undertakings to create a unique product or service. The idea of time is inherent to the very definition of a project in that all projects are temporary. Even though they may seem to last forever, sooner or later they must end. Adequate planning of the temporary project can predict when a project will end. Within this short, limited time, the project manager must create something: a product or a service. The creation is about change—and change, as you may have guessed, takes time.
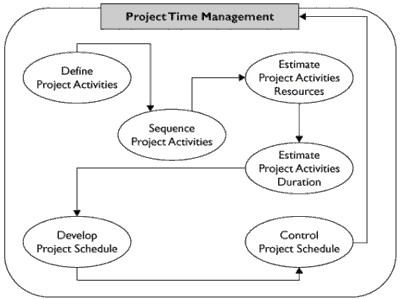
Time management relies on several inputs to monitor and control the project schedule.
Creation of the product or service comes about due to the work the project team completes. The sum of the time of the work equates to when the project is completed. In addition to the duration of activities, there are other factors of time to consider, such as the following:
● Project management activities
● Planning processes
● The sequence of activities
● Procurement
● Reliance on internal and external events
● Known and unknown events affecting the project
Sequencing Project Activities
Now that the activity list has been created, the activities must be arranged in a logical sequence. This process calls on the project manager and the project team to identify the logical relationships between activities and the preferred relationship between those activities. This can be accomplished in a few different ways.
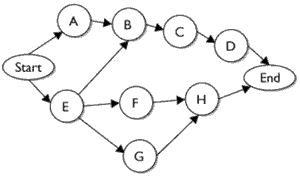
The precedence diagramming method (PDM) is the most common method of arranging the project work visually. The PDM puts the activities in boxes, called nodes, and connects the boxes with arrows. The arrows represent the relationship and the dependencies of the work packages. The following illustration shows a simple network diagram using PDM.
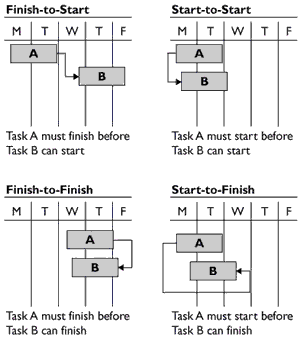
Relationships between activities in a PDM constitute one of four different types:
Finish-to-start (FS) This relationship means Task A must be completed before Task B can begin.
Start-to-start (SS) This relationship means Task A must start before Task B can start. This relationship allows both activities to happen in tandem.
Finish-to-finish (FF) This relationship means Task A must complete before Task B does. Ideally, two tasks must finish at exactly the same time, but this is not always the case.
Start-to-finish (SF) This relationship is unusual and is rarely used. It requires that Task A start so that Task B may finish.
Considering Leads and Lags
Leads and lags are values added to work packages to slightly alter the relationship between two or more work packages. Lead time is considered a negative value because time is subtracted from the downstream activity to bring successor activities closer to the start of the project.

Examining the Sequencing Outputs
There are many approaches to using activity sequencing: a project manager and the project team can use software programs, the approach can be done manually, or the team can manually do the scheduling and then transfer the schedule into a PMIS. Whichever method is selected, the project manager must remember four things.
● Only the required work should be scheduled.
● Finish-to-start relationships are the most common and preferred.
● Activity sequencing is not the same as a schedule.
● Scheduling comes after activity sequencing.
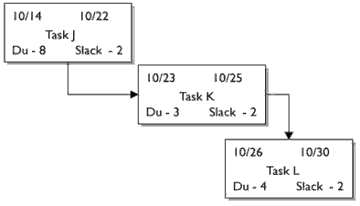
A project network diagram (PND) illustrates the flow of the project work and the relationship between the work packages. PNDs are typically "activity on node" (AON), and most PMIS packages use the PDM method. The following illustration is a typical example of a network diagram.
Considering the Resource Requirements
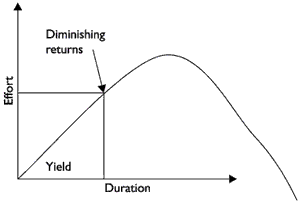
The identified resource requirements will affect the project schedule. Remember the difference between duration and effort? Duration is how long the activity will take, while effort is the labor applied to the task.
Estimating Activity Durations
Activity duration estimates, like the activity list and the WBS, don't come from the project manager—they come from the people completing the work. They may also undergo progressive elaboration. In this section, we'll examine the approach to completing activity duration estimates, the basis of estimates, and the allowance for activity list updates.
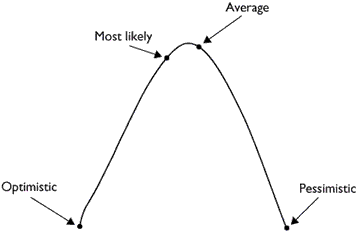
How confident can a project manager be when it comes to estimating? If the project work has been done before in past projects, the level of confidence in the duration estimate is probably high. But if the work has never been done before, there are lots of unknowns—and with that comes risk. To mitigate the risk, the project manager
can use a three-point estimate. A three-point estimate requires that for each activity, optimistic, most likely, and pessimistic time estimates be created.
(Optimistic time + (4 × Most likely time) + Pessimistic time)/6
Developing the Project Schedule
Another key input to schedule creation is the activity duration estimates. Constraints will restrict when and how the project may be implemented. Perhaps one of the biggest constraints is the predetermined project deadline.
● Start no earlier than (SNET) This constraint requires that the project or activity not start earlier than the predetermined date. Consider an activity to add software to an existing network server in a technology project. The project manager adds a "start no earlier than" constraint to the activity to ensure the activity begins on a Saturday when the server is not in use by the organization. The activity can begin any time after the preset date, but not before it.
● Start no later than (SNLT) This constraint requires the activity to begin by a predetermined date.
● Finish no later than (FNLT) This constraint requires the project or activity to finish by a predetermined date.
● Finish no earlier than (FNET) This somewhat unusual constraint requires the activity to be in motion up until the predetermined date. Consider a project to create a special blend of wine. The wine must be aged a specific amount of time before the winemaking process can continue. Thus, the process requires a set amount of time so it may "finish no earlier than" the determined time. The activity can end any time after the preset date, but not before it.
Defining the Project Timeline
● Creating the project schedule is part of the planning process group. It is calendar based and relies on both the project network diagram and the accuracy of time estimates.
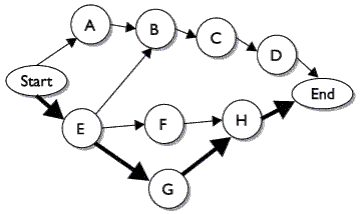
● The most common approach to calculating when a project may finish is by using the critical path method. It uses a "forward" and "backward" pass to reveal which activities are considered critical. Activities on the critical path may not be delayed; otherwise, the project end date will be delayed.
● The critical path is used to determine which activities have no float. You can also use the critical path to determine the earliest date for when the project may be completed. There can be more than one critical path in a project, and it's possible for the critical path to change as the project proceeds.
Calculating Float in a PND
Float, or slack, is the amount of time a task can be delayed without delaying the project's completion. Technically, there are three different types of float.
● Free float This is the total time a single activity can be delayed without delaying the early start of any successor activities.
● Total slack This is the total time an activity can be delayed without delaying project completion.
● Project slack This is the total time the project can be delayed without passing the customer-expected completion date.
Project Cost Management
Costs associated with projects are not just the costs of goods procured to complete the project. The cost of the labor may be one of the biggest expenses of a project. The project manager must rely on time estimates to predict the cost of the labor to complete the project work. In addition, the cost of the equipment and materials needed to complete the project work must be factored into the project expenses.
Direct costs These costs are attributed directly to the project work and cannot be shared among projects (airfare, hotels, long distance phone charges, and so on).
Indirect costs These costs are representative of more than one project (utilities for the performing organization, access to a training room, project management software license, and so on).
Variable costs These costs vary, depending on the conditions applied in the project (the number of meeting participants, the supply and demand of materials, and so on).
Fixed costs These costs remain constant throughout the project (the cost of a piece of rented equipment for the project, the cost of a consultant brought onto the project, and so on).
Involving Risks
Most risks, especially the probable, high-impact, negative ones, need to pass through quantitative analysis to determine how much the risk may cost the project in time and cost. Based on risk analysis, the project manager creates a special budget just for the impact of project risks: the risk contingency reserve. You need the risk register here in cost estimating to determine how much cash you'll need to offset the risk events as part of your cost estimates.
Contingency reserves can be managed a number of different ways. The most common is to set aside an allotment of funds for the identified risks within the project. Another approach is to create a slush fund for the entire project for identified risks and "known unknowns." The final approach is an allotment of funds for categories of components based on the WBS and the project schedule.
Cost Estimates
Project files
Past projects within the performing organization can be used as a reference to predict costs and time. Caution must be taken that the records referenced are accurate, somewhat current, and reflective of what was actually experienced in the historical project.
Commercial cost-estimating databases
These databases provide estimates of what the project should cost based on the variables of the project, resources, and other conditions.
Team members
Team members may have specific experience with the project costs or estimates. Recollections may be useful, but are highly unreliable when compared to documented results.
Lessons learned
Lessons-learned documentation can help the project team estimate the current project if the lessons are from a similar project scope.
Three-Point Cost Estimate
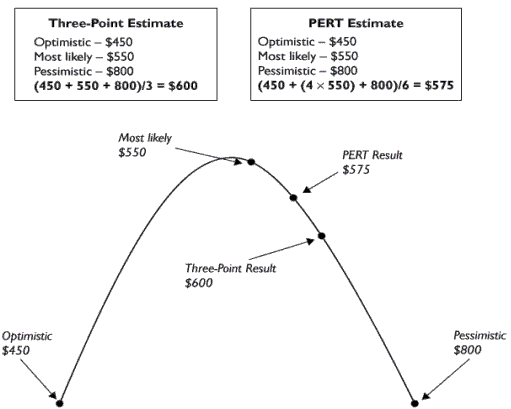
It's risky to sometimes use just one cost estimate for a project's activity, especially when it's work that hasn't been completed before. And like any project work, you don't know how much it's really going to cost until you pay for it. Issues, errors, delays, and unknown risks can affect the project cost. A three-point cost estimate attempts to find the average of the cost of an activity using three factors.
● Optimistic cost estimate
● Most likely cost estimate
● Pessimistic cost estimate
Cost Change Control System
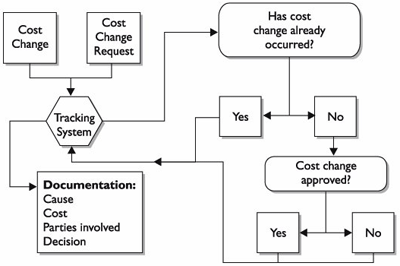
Sometimes a project manager must add or remove costs from a project. The cost change control system is part of the integrated change control system and documents the procedures to request, approve, and incorporate changes to project costs. When a cost change enters the system, there is appropriate paperwork, a tracking system, and procedures the project manager must follow to obtain approval on the proposed change.
Measuring Project Performance
Earned value management (EVM) is the process of measuring the performance of project work against a plan to identify variances. It can also be useful in predicting future variances and the final costs at completion. It is a system of mathematical formulas that compares work performed against work planned and measures the actual cost of the work performed. EVM is an important part of cost control since it allows a project manager to predict future variances from the expenses to date within the project.
Planned value (PV)
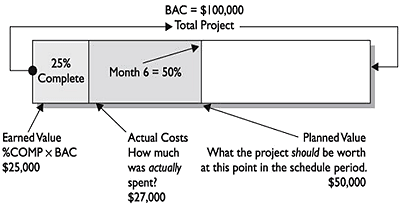
Planned value is the work scheduled and the budget authorized to accomplish that work. For example, if a project has a budget of $100,000 and month six rep-
resents 50 percent of the project work, the PV for month six is $50,000. The entire project's planned value—that is, what the project should be worth at completion—is known as the budget at completion. You might also see the sum of the planned value called the performance measurement baseline.
Earned value (EV)
Earned value is the physical work completed to date and the authorized budget for that work. For example, if a project has a budget of $100,000 and the work
completed to date represents 25 percent of the entire project work, its EV is $25,000.
Actual cost (AC) Actual cost is the actual amount of monies the project has required to date. For example, if a project has a budget of $100,000 and $35,000 has been spent on the project to date, the AC of the project would be $35,000.
Finding the Variances
At the end of the project, will there be a budget variance (VAR)? Any variance at the end of the project is calculated by subtracting the actual costs (ACs) of the project work from the budget at completion (BAC). The term BAC refers to the estimated budget at completion—what you and the project customer agree the project
will likely cost. Of course, you don't actually know how much the project will cost until it's completely finished. So throughout the project, a variance is any result that is different from what is planned or expected.
Cost Variances
The cost variance (CV) is the difference between the earned value and the actual costs (AC). For example, for a project that has a budget of $200,000 and has earned or completed 10 percent of the project value, the EV is $20,000. However, due to some unforeseen incidents, the project manager had to spend $25,000 to complete
that $20,000 worth of work. The AC of the project, at this point, is $25,000 and the cost variance is -$5,000. Thus, the equation for cost variance is CV = EV - AC.
Schedule Variances
A schedule variance (SV) is the value that represents the difference between where the project was planned to be at a certain point in time and where the project actually is. For example, consider a project with a budget of $200,000 that's expected to last two years. At the end of year one, the project team has planned that the project be 60 percent complete. Thus, the planned value (PV) for 60 percent completion equates to $120,000—the expected worth of the project work at the end of year one. But let's say that at the end of year one the project is only 40 percent complete. The EV at the end of year one is, therefore, $80,000. The difference between the PV and the EV is the SV: -$40,000. The equation for schedule variance is SV = EV - PV.
Calculating the Cost Performance Index
The cost performance index (CPI) shows the amount of work the project is completing per dollar spent on the project. In other words, a CPI of 0.93 means it is
costing $1.00 for every 93 cents' worth of work. Or you could say the project is losing seven cents on every dollar spent on the project. Let's say a project has an
EV of $25,000 and an AC of $27,000. The CPI for this project is thus 0.93. The closer the number is to 1, the better the project is doing. The equation for cost per-
formance index is CPI = EV / AC.
CPI is a value that shows how the project costs are performing to plan. It relates the work you've accomplished to the amount you've spent to accomplish it. A project with a CPI of 0.93 means you're spending 1.00 for every 0.93 worth of work accomplished. Therefore, a CPI under 1.00 means the project is performing poorly against the plan. However, a CPI over 1.00 does not necessarily mean that the project is performing well either. It could mean that estimates were inflated or that an expenditure for equipment is late or sitting in accounts payable and has not yet been entered into the project accounting cycle.
Quality Project Management
Customer satisfaction
The project must satisfy the customer requirements by delivering what it promised in order to satisfy the needs of the customer. The PM-
BOK states it as "conformance to requirements" and "fitness for use."
Prevention
Quality is planned into a project, not inspected in. It is always more cost-effective to prevent mistakes than to correct them.
Management responsibility
The project team must work towards the quality goal, but management must provide the needed resources to deliver on the quality
promises.
Kaizen technology
Kaizen is a quality management philosophy of applying continuous small improvements to reduce costs and ensure consistency or project performance.
Marginal analysis
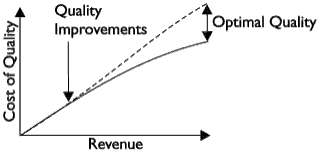
Marginal analysis studies the cost of the incremental improvements to a process or product and compares it against the increase in revenue made from the improvements. For example, the price of the added feature may cost the company $7.50 per unit, but the amount of gained sales per year because of the improvement will meet or exceed the cost of the improvement.
Preparing for Quality
Top management should define the quality policy; this is part of the organizational process assets. The quality policy of the organization may follow a formal approach, such as ISO 9000, Six Sigma, or quality function deployment, or it may have its own direction and approach to satisfying the demand for quality. There
are loads of proprietary quality management methodologies.
Planning for Quality
Benefit
Completing quality work increases productivity because shoddy work does not have to be redone. When work is completed correctly the first time as expected, the project does not have to spend additional funds to redo the work.
Costs
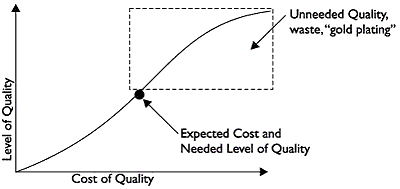
Completing quality work may cost more monies than the work is worth. To deliver a level of quality beyond what is demanded costs the project additional funds. The types of quality management activities that guarantee quality may not be needed for every project.
Gold plating
The customer does not need or want more than what was requested. Gold plating is the process of adding extra features that may drive up costs and alter schedules. The project team should strive to deliver what was expected.
Quality Assurance
There are several inputs the project manager and the project team will need to prepare for QA.
● The quality management plan
This plan defines how the project team will implement and fulfill the quality policy of the performing organization.
● Quality metrics
Quality control tests will provide these measurements. The values must be quantifiable so results may be measured, compared, and analyzed. In other words, "pretty close to on track" is not adequate; "95 percent pass rate" is more acceptable.
● The process improvement plan
This plan aims to improve the project, not just the project's product.
● Work performance information
The results of the project work as needed—this includes technical performance measures, project status, information on what the project has created to date,
corrective actions, and performance reports.
● Results of quality control
The measurements taken by the project manager and the project team to inspect the project deliverables' quality are fed back into the QA process.
● Implemented actions
Any change requests, defect repairs, corrective actions, or preventive actions that have been taken in the project should be documented and submitted to the QA process.
Implementing Quality Control
Quality control (QC) requires the project manager, or another qualified party, to monitor and measure project results to determine that the results are up to the demands of the quality standards. If the results are unsatisfactory, root-cause analysis follows the quality control processes. Root cause analysis is needed so the project manager can determine the cause and apply corrective actions. QC occurs throughout the life of a project, not just at its end.
QC is also not only concerned with the product the project is creating, but with the project management processes. QC measures performance, scheduling, and cost variances. The experience of the project should be of quality—not just the product the project creates. Consider a project manager that demands the project team work extreme hours to meet an unrealistic deadline; team morale suffers and likely so does the project work the team is completing.
CategoryDelete
Diese Seite wurde noch nicht kommentiert.


